LAB
DATA SCIENCE
Bellabeat Wellness Case Study
Bellabeat is a high-tech manufacturer of health-focused smart products for women that keeps them informed of their health and activities inspiring and motivating them to take necessary steps in maintaining their health. The aim of this report is to analyse non-Bellabeat devices` smart device usage data to gain insights on some smart device trends, how these trends can be applied to Bellabeat customers and how these trends could be incorporated in any one Bellabeat product`s marketing strategy.
Coal & Lignite Production VS Consumption
This project aims to investigate the Coal and Lignite production vs consumption trends in major countries and associations using EDA and Data visualizations and also aims to apply Univariate time series forecasting to predict future trends of the production and consumption of the major regions/continents.
DATA VISUALIZATION
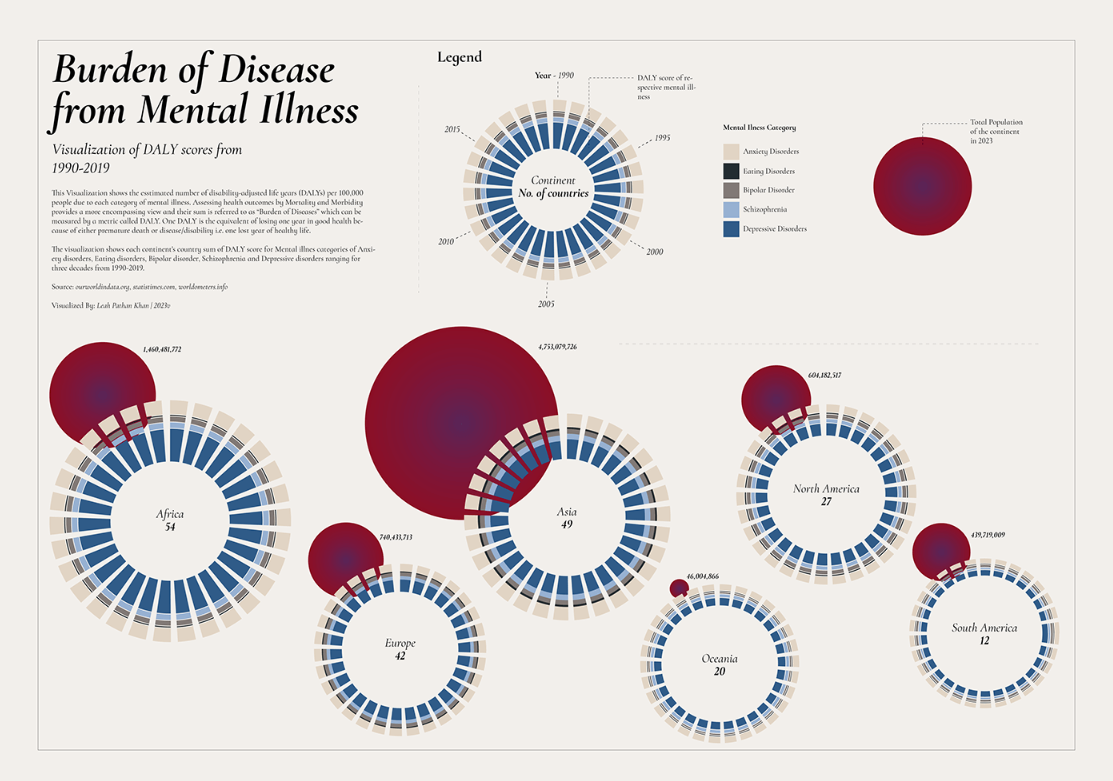
Burden of Disease from Mental Illness
The visualization shows the estimated number of disability-adjusted life years (DALYs) per 100,000 people due to each category of mental illness, Assessing health outcomes by Mortality and Morbidity provides a more encompassing view and their sum is referred to as "Burden of Diseases" which can be measured by DALY. One DALY is equivalent to losing one year on good health because of either premature death or disease/disability i.e. one lost year of healthy life. This visualization shows each continent's country sum of DALY score for Mental Ilnesses from 1990-2019.
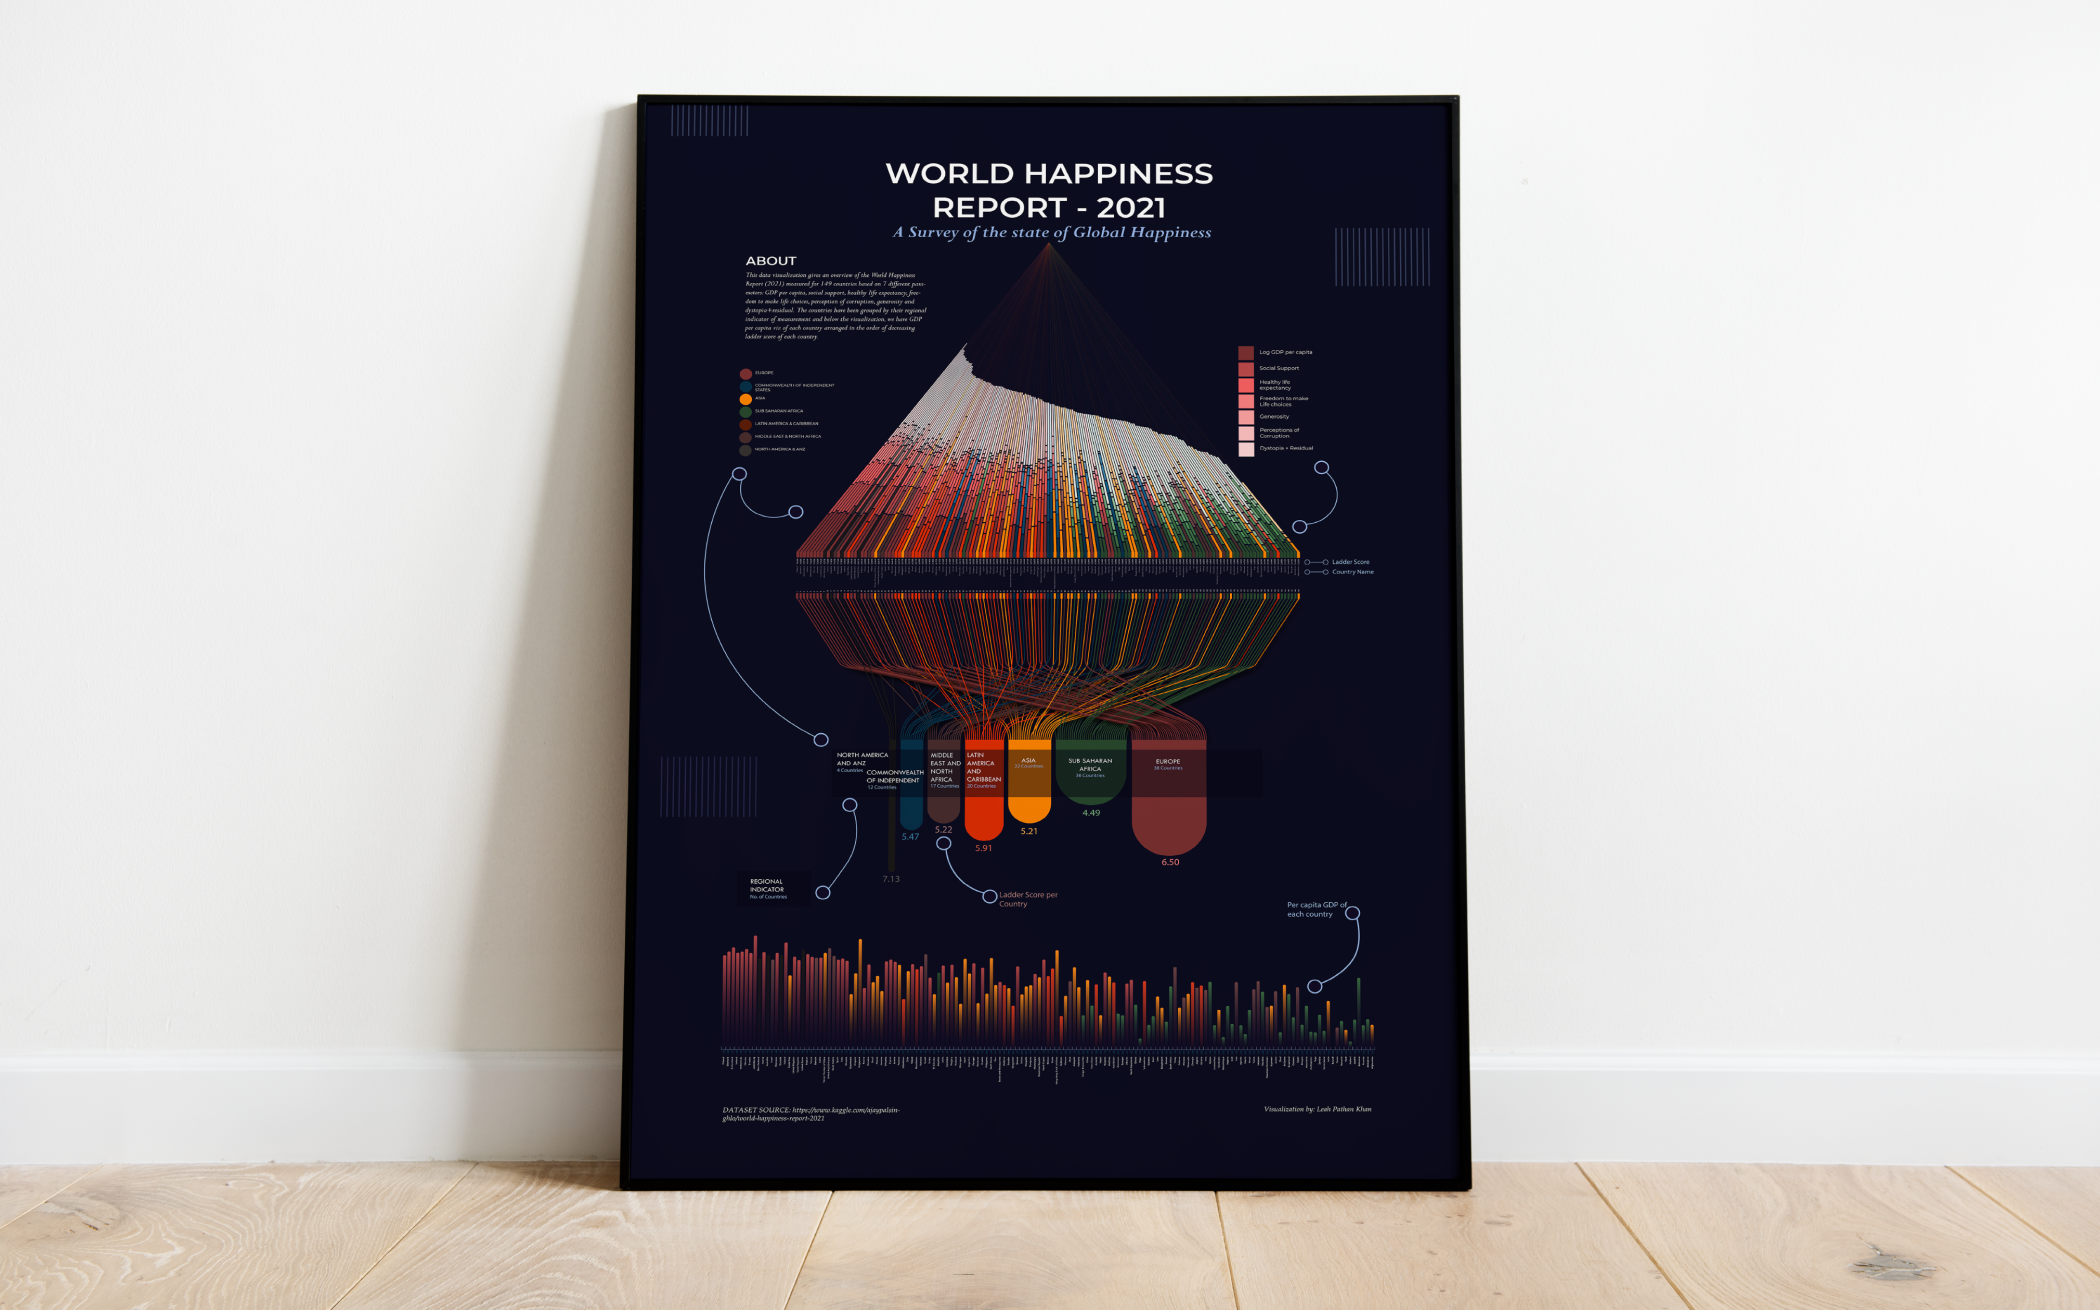
World Happiness Report 2021
This data visualization gives an overview of the World Happiness Report (2021) measured for 149 countries based on 7 different parameters: GDP per capita, social support, healthy life expectancy, freedom to make life choices, perception of corruption, generosity and dystopia+residual. The countries have been grouped by their regional indicator of measurement and below the visualization, we have GDP per capita viz of each country arranged in the order of decreasing ladder score of each country.
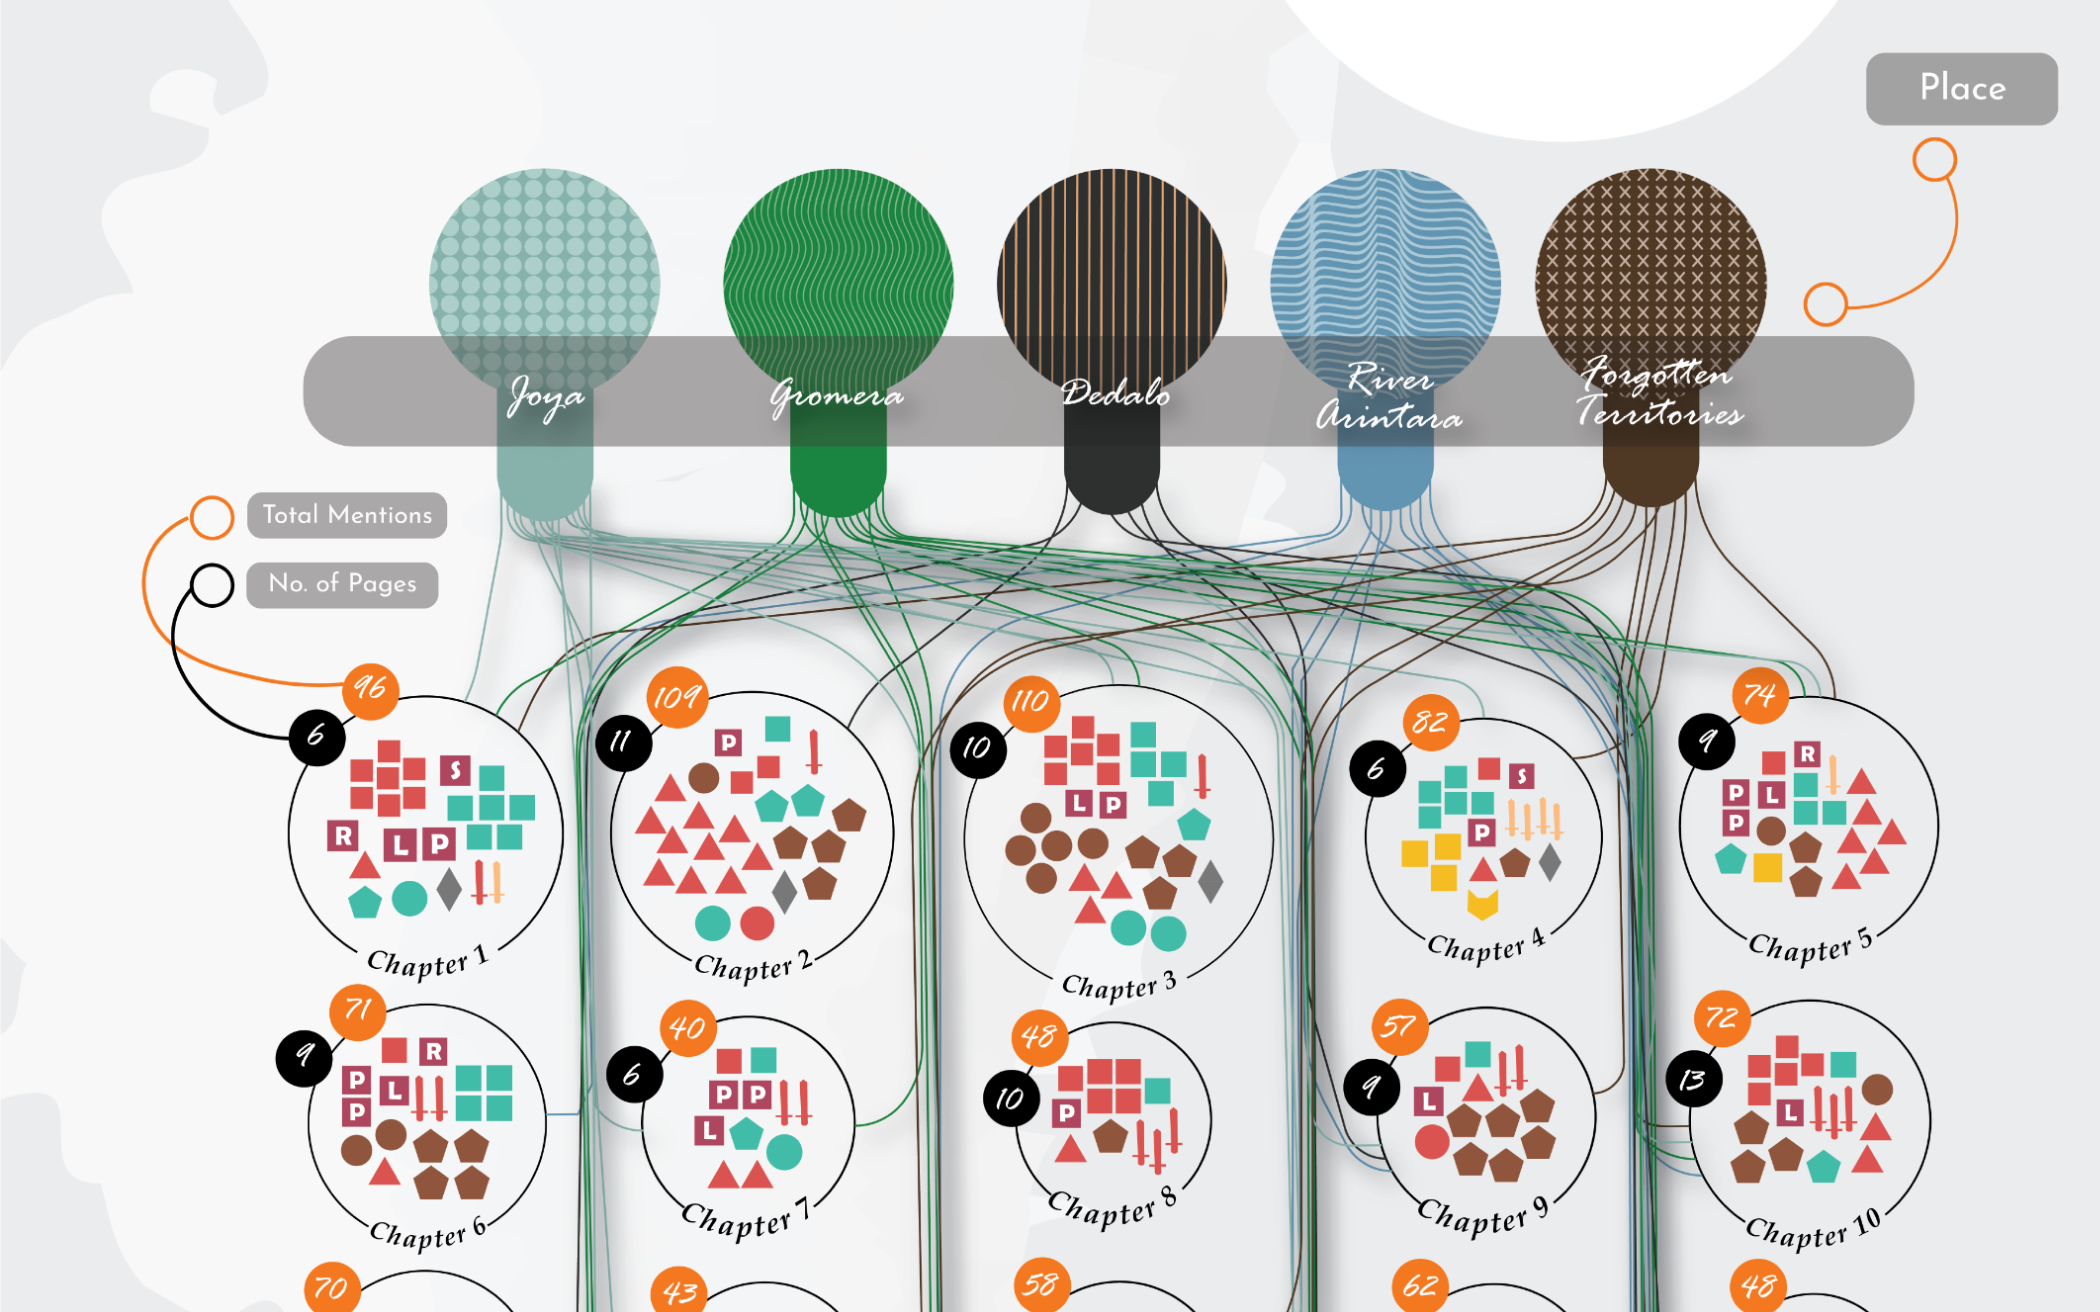
Book Character Count Viz [The Girl of Ink & Stars
This visualization gives an overview about the total number of times a character has been mentioned in each chapter (excluding the direct speeches). There is a total of 25 chapters and each chapter has been represented in the circles below with their character counts. The visualization also directs the mention of each place (Joya, Gromera, Dedalo, River Arintara and Forgotten Territories) to their chapters.
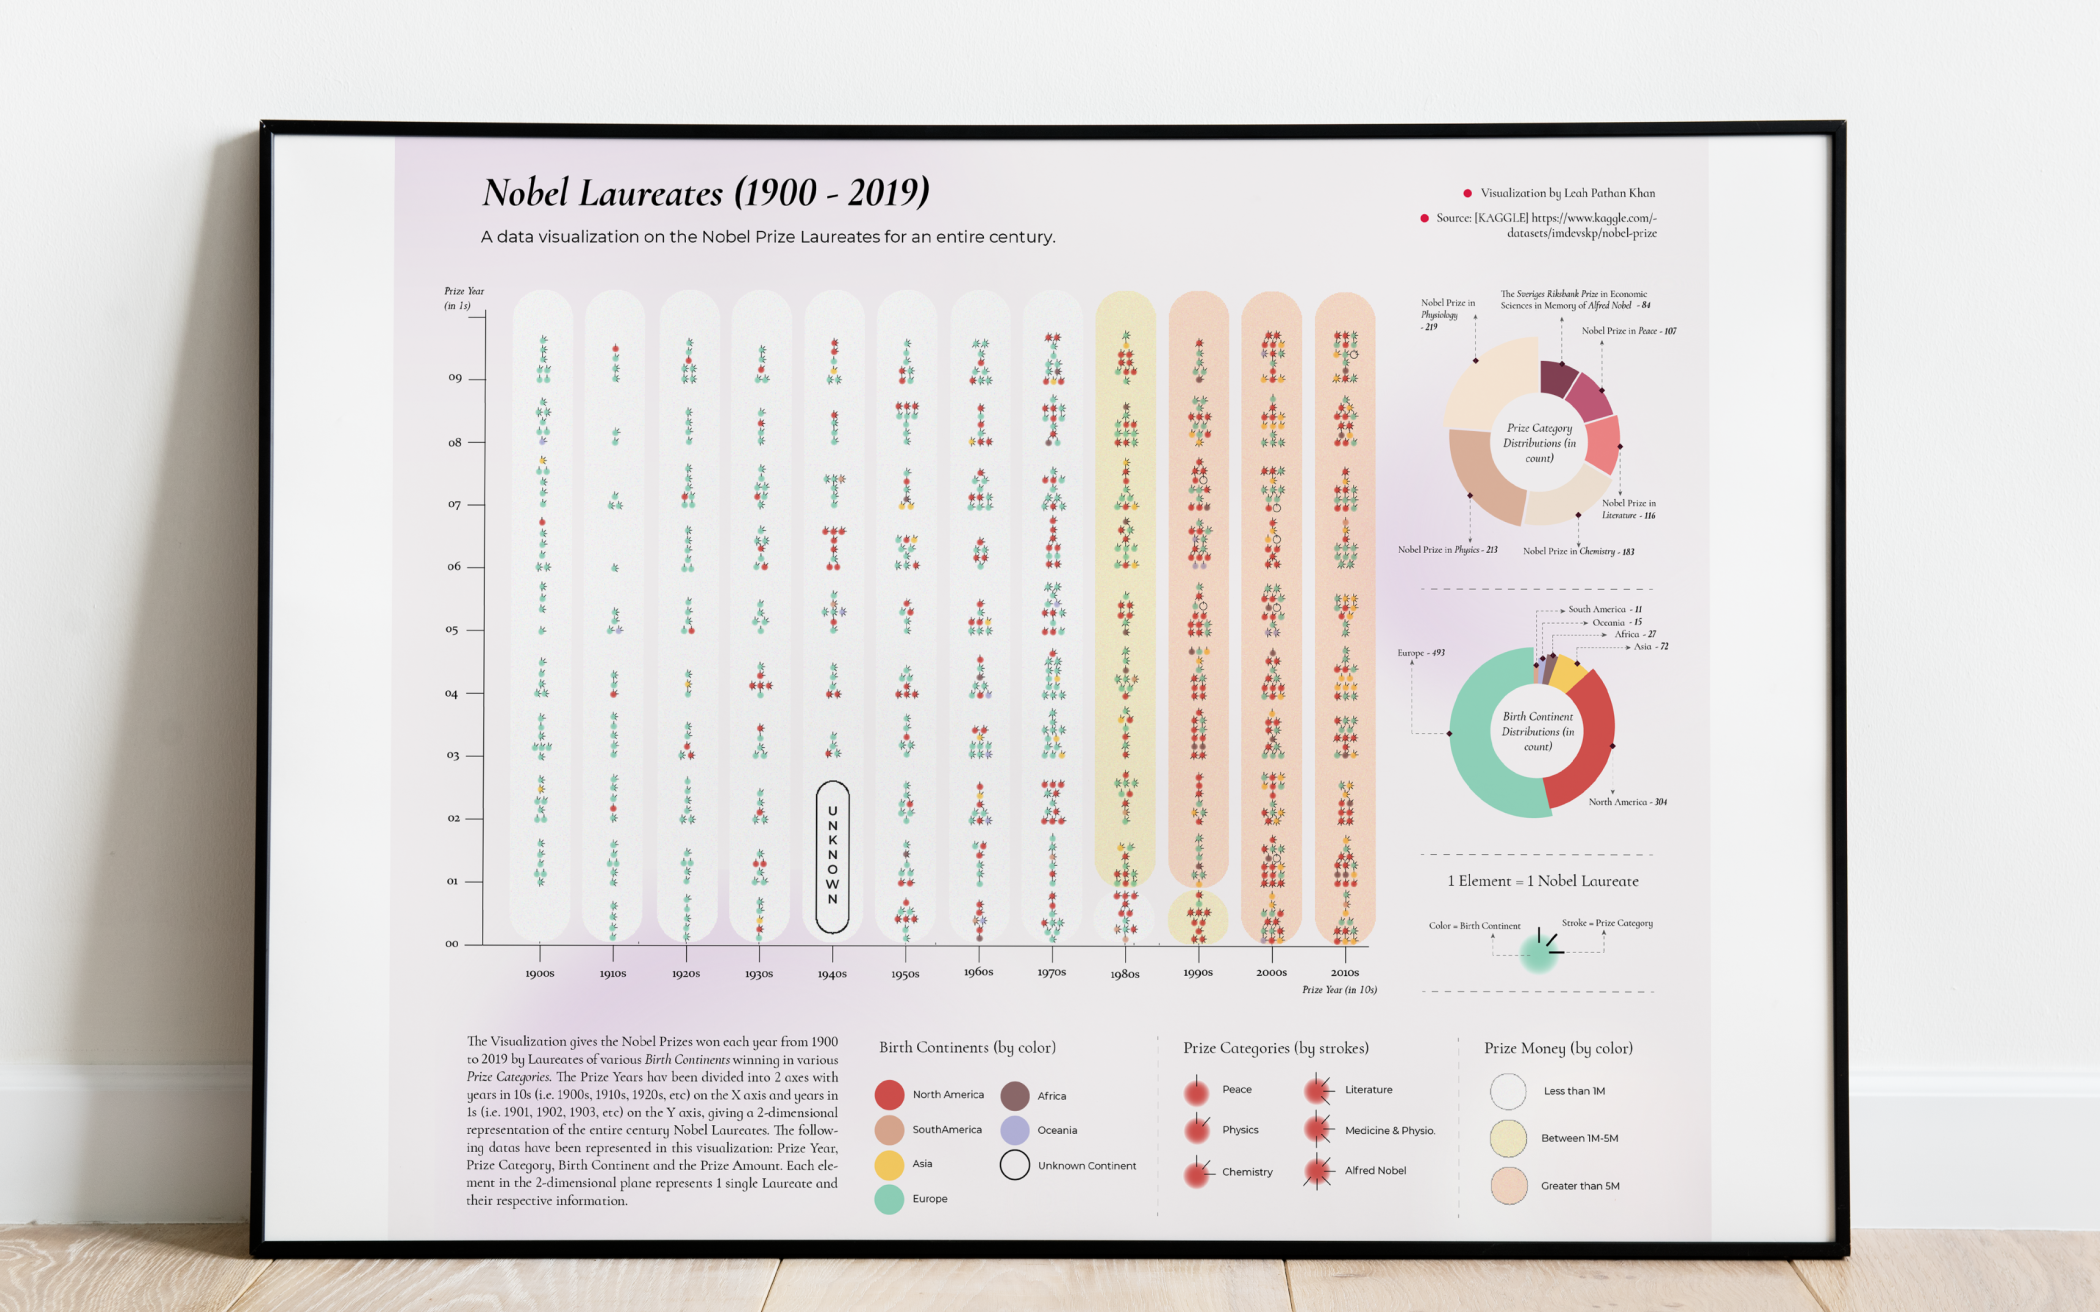
Nobel Laureates Century Viz
The Visualization gives the Nobel Prizes won each year from 1900 to 2019 by Laureates of various Birth Continents winning in various Prize Categories. The Prize Years hav been divided into 2 axes with years in 10s (i.e. 1900s, 1910s, 1920s, etc) on the X axis and years in 1s (i.e. 1901, 1902, 1903, etc) on the Y axis, giving a 2-dimensional representation of the entire century Nobel Laureates. The following datas have been represented in this visualization: Prize Year, Prize Category, Birth Continent and the Prize Amount. Each element in the 2-dimensional plane represents 1 single Laureate and their respective information.
PUBLICATION
StoryGenAI: An Automatic Genre-Keyword Based Story Generation
IEEE | 21 Jul, 2023
An Efficient Supervised Deep Learning Approach for Covid chest Image Classification from Deep Residual Networks
IEEE | 10 Dec, 2021
MISCELLANEOUS

